Medicare reimbursement decline is the long-term reduction in physician payment rates under the Medicare Physician Fee Schedule, measured in real terms against inflation, typically affecting outpatient clinic owners whose Medicare patient volume is 20% or more of total revenue, creating a structural gap between rising practice costs and declining per-visit payment.
A 25-year pay cut
In 2001, the Medicare physician fee schedule paid a certain amount for an office visit. In 2026, it pays less for the same visit. Not adjusted for inflation. The actual dollar amount is lower in some cases.
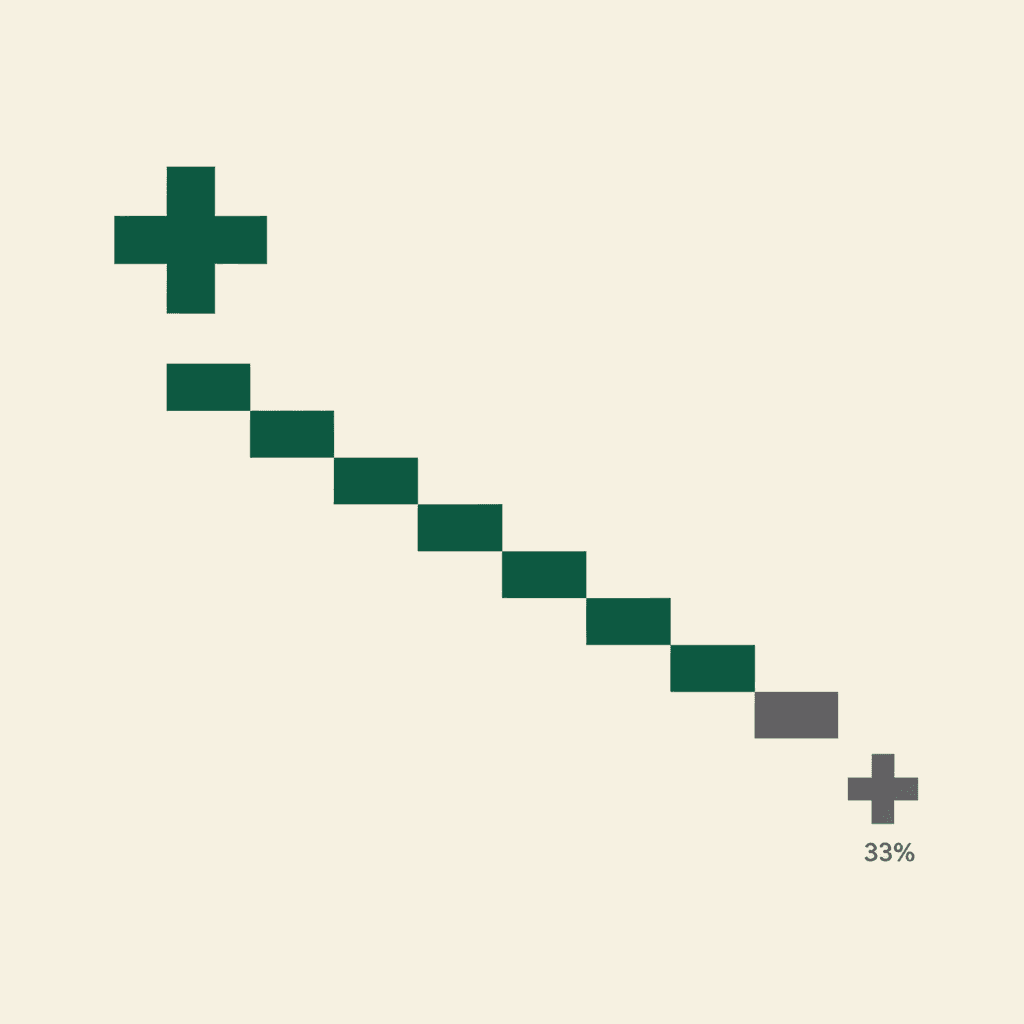
When you adjust for inflation, the picture is brutal. Medicare reimbursement to physicians has declined approximately 33% in real terms since 2001 (according to AMA analysis). Over the same period, practice operating costs (rent, staff, supplies, malpractice insurance) have increased by roughly 59% according to the same AMA analysis.
That means Medicare payments have moved in one direction while practice costs have moved in the other. The purchasing power of a Medicare dollar has been cut roughly in half over 25 years. For a practice that depends heavily on Medicare patients, this is not a trend. It is a slow-motion financial crisis. For strategies on how profitable clinics adapt their financial model in response, see what smart clinics do when insurance reimbursement keeps dropping.
And it is going to get worse.
Why the decline keeps compounding
The Medicare physician payment system was never designed to keep up with costs. It was designed to stay within a budget. That design choice is now decades old, and every year it pushes payments further behind.
The conversion factor keeps shrinking — even when it nominally ticks up. Medicare reimbursement is calculated by multiplying a procedure's Relative Value Unit (RVU) by a dollar conversion factor. In 2001, the conversion factor was $38.26. For 2025, it was $32.35. CY 2026 split the conversion factor for the first time under CMS-1832-F: $33.5675 for clinicians who are qualifying participants (QPs) in advanced alternative payment models, and $33.4009 for everyone else, a nominal increase of +3.77% and +3.26% respectively over the 2025 value. Even with that bump, the 2026 non-QP multiplier is still roughly 12-13% below the 2001 base in nominal dollars — and the real-terms gap is much wider once medical practice cost inflation compounds on top.
Congress intervenes periodically to keep the conversion factor from sliding further. For 2025, a temporary 2.93% increase from 2024 expired and Congress failed to prevent the resulting cut. For 2026, the Physician Fee Schedule Final Rule (CMS-1832-F) built in the +3.26% / +3.77% step described above, and beginning in CY 2026 the conversion factor is split into two tracks by statute. These periodic adjustments keep the system on life support without fixing the underlying structural problem.
Budget neutrality forces a zero-sum game. When CMS increases payment for one service (say, chronic care management codes), it must decrease payment for other services to keep total spending flat. So every time CMS adds a new code or increases reimbursement for a priority area, existing procedure payments get trimmed. Your payments go down not because your service is worth less, but because Medicare is paying more for something else.
MedPAC recommendations are below inflation. The Medicare Payment Advisory Commission (MedPAC) advises Congress on Medicare payment policy. For 2027, MedPAC has recommended a 0.5% payment increase. The Consumer Price Index for medical care is running at 3-4%. A 0.5% increase against 3-4% inflation is a real-terms pay cut of 2.5-3.5%. This is the recommendation from the body that is supposed to advocate for adequate payment.
What this looks like at the practice level
Let me walk through the math for a specific scenario.
A multi-specialty outpatient practice does $5M in annual revenue. Their payer mix is 30% Medicare, 50% commercial insurance, and 20% self-pay and other.
Medicare revenue: $1,500,000.
If Medicare reimbursement declines 2% in real terms each year (which is roughly what has been happening), that is $30,000 in lost purchasing power per year. Over five years, the cumulative loss is $150,000, and the annual impact is now $150,000 below where it would have been with inflation-adjusted payments.
For a practice with a 15% net margin, $150,000 represents 3% of total revenue and 20% of net profit. That is not a nuisance. That is the difference between a healthy practice and one that is slowly running out of margin.
Now consider a practice with 50% Medicare mix. Same $5M in revenue, but $2,500,000 from Medicare. The same 2% annual real decline produces $50,000 in lost purchasing power per year. Over five years, $250,000. At that point, you are looking at a practice that may not be viable at its current cost structure unless something changes.
Which specialties are most exposed
Not every practice has the same Medicare dependency. The ones with the highest Medicare patient percentages feel the squeeze most.
Podiatry. Medicare represents roughly 40-50% of revenue for a typical podiatry practice. The elderly population needs foot care, and Medicare is their primary coverage. A podiatry practice doing $1.5M with 45% Medicare mix is losing $13,500 per year in real purchasing power, compounding annually.
Ophthalmology. Similar to podiatry, with 35-45% Medicare mix. Cataract surgery reimbursement has been cut repeatedly. The Medicare physician fee for cataract extraction with IOL has declined significantly over the past two decades while the procedure takes the same amount of skill and the same amount of time.
Cardiology and pulmonology. High Medicare mix due to the patient population, typically 35-45%. These specialties also face the compounding effect of budget neutrality adjustments as CMS shifts payments toward primary care and chronic care management.
Physical therapy. Medicare PT visits are subject to therapy caps and medical review thresholds. PT reimbursement has been particularly pressured, and the per-visit payment does not reflect the one-on-one time required.
Primary care. While CMS has tried to increase primary care payments through new codes (chronic care management, transitional care management, principal care management), the base E/M visit payments have not kept pace. A 99214 office visit pays roughly $95-$110 from Medicare in a non-facility setting under the CY 2025 conversion factor of $32.35 (non-facility total RVU of approximately 3.0 yields about $97); the CY 2026 split conversion factors ($33.40 non-QP / $33.57 QP) raise the payment slightly. Either way, the cost of delivering that visit in a practice with current rent, staffing, and overhead costs is uncomfortably close to or above what Medicare pays.
Dental practices are largely insulated because traditional Medicare does not cover most dental services. But if Medicare expands dental coverage (which has been proposed repeatedly), dental practices that accept Medicare would immediately inherit this payment trend.
The CMS Ambulatory Specialty Model: January 2027
Starting January 2027, CMS is launching the Making Care Primary (MCP) and the Transforming Episode Accountability Model (TEAM) programs, along with developments in the Ambulatory Specialty Model. These value-based care programs aim to shift specialist payment from fee-for-service to episode-based or outcomes-based payment. MIPS reporting is closely tied to how your practice positions itself within this shifting payment landscape — see the 2026 MIPS reporting checklist for what to track this year.
The Ambulatory Specialty Model specifically targets specialists treating heart failure and low back pain. If your practice treats these conditions, you may be enrolled or eligible for this model. The basic idea: instead of getting paid per visit, you get a bundled payment for managing a patient through an episode of care. If your costs are below the target, you keep the savings. If they are above, you absorb the loss.
This is not optional for some practices. CMS is moving toward mandatory participation in certain geographies.
Whether value-based care helps or hurts your practice depends entirely on your cost structure and your ability to manage patients efficiently. Practices with good data, strong care coordination, and controlled costs can do well under episode-based payment. Practices that do not know their cost per episode will take on financial risk they cannot quantify.
If you are in a specialty that is likely to fall under a value-based model, start tracking your cost per episode now. You need to know what it costs to manage a heart failure patient for 90 days, or what a low back pain episode costs from first visit through 6 months of follow-up. Without that data, you are walking into a new payment model blind.
What clinic owners should do
Analyze your Medicare dependency
Pull a report of revenue by payer for the last 12 months. What percentage of total revenue comes from Medicare? What percentage comes from Medicare Advantage (which follows different, often worse, reimbursement schedules)?
If Medicare and Medicare Advantage combined exceed 35% of your revenue, you have meaningful exposure to this trend. That does not mean you should stop seeing Medicare patients. But it means you need a plan for a future where that revenue stream pays less every year.
Model the revenue impact
Take your current Medicare revenue. Apply a 2% real decline per year for the next five years. What does your revenue look like? What does your margin look like?
If the answer is "we are still profitable," good. If the answer is "we are at break-even by year three," you need to act now, not in year three.
Build alternative revenue
Self-pay and cash-pay services. Many specialties have services that patients will pay for out of pocket. PT practices can offer wellness programs. Dermatology practices can offer cosmetic services. Ophthalmology practices can upsell premium IOLs and refractive procedures. These services are not subject to Medicare pricing.
Ancillary revenue. In-house labs, imaging, dispensing (where legally permitted), and supplements. Ancillary services can add 5-15% to practice revenue at margins that exceed your core clinical services.
Chronic care management billing. CMS actually pays reasonably well for chronic care management (99490, 99491) and remote patient monitoring (99453, 99454, 99457, 99458). Many practices are leaving this money on the table because they have not set up the workflows. For a practice with 200 Medicare patients with two or more chronic conditions, CCM billing alone can generate $100,000-$200,000 per year.
Renegotiate commercial contracts
If Medicare pays less, your commercial payer contracts matter more. Our fractional CFO services include payer contract analysis and renegotiation support — this is one of the highest-ROI activities for practices with significant Medicare exposure. Many practices have not renegotiated their commercial rates in 3-5 years. Commercial payers typically pay 120-200% of Medicare rates. But if your contract is old and your volume has grown, you may have leverage to negotiate higher rates.
Collect your utilization data, your quality metrics, and your patient satisfaction scores. Approach your top three commercial payers with a data-driven case for a rate increase. Even a 3-5% increase on commercial rates can offset a significant portion of the Medicare decline.
Watch your payer mix over time
Payer mix is not static. As your patient population ages, your Medicare percentage can creep up without you noticing. A practice that was 25% Medicare five years ago might be 35% today simply because its existing patients aged into Medicare.
Track payer mix quarterly. If Medicare is growing as a percentage of revenue, that is not necessarily bad, but it changes your financial model. Make sure your planning reflects your actual payer mix, not the payer mix you had three years ago.
This is not a problem that solves itself
Congress has had 25 years to fix the Medicare physician payment system. They have not. Every year, they pass a short-term patch that prevents the worst of the scheduled cuts, and every year the real value of Medicare payments declines.
Waiting for a legislative fix is not a financial strategy. The practices that will remain profitable over the next decade are the ones that treat Medicare reimbursement decline as a known variable and plan around it.
If you want to see how Medicare trends affect your specific practice, take the free assessment. We will model the impact on your revenue and margins and help you build a payer mix strategy that works.


